| Neural Network Toolbox | Search Help Desk |
| hintonwb | Examples See Also |
Hinton graph of weight matrix and bias vector
hintonwb(W,b,maxw,minw)hintonwb
(W,B,maxw,minw) takes these inputs,
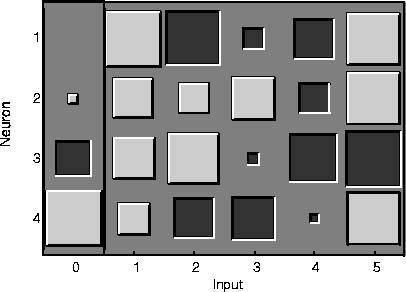
and displays a weight matrix and a bias vector represented as a grid of squares.
Each square's area represents a weight's magnitude. Each square's projection (color) represents a weight's sign; inset (red) for negative weights, projecting (green) for positive. The weights are shown on the left.
The following code produces the result shown below.
W = rands(4,5);
b = rands(4,1);
hintonwb(W,b)
hintonw