Python Reading
- Read this MatPlotLib
tutorial
through the section called Working with text.
Getting Started
- Install matplotlib on your machine:
- Windows: python -m pip install matplotlib
- Mac: pip3 install --user matplotlib
Lecture Activity
In-Class Activity
- Modify graphs.py to label the x-axis as x and
the y-axis as y.
- Modify graphs.py to plot the straight lines with magenta dashes.
Hint.
- Modify graphs.py to draw the sine wave with 5 point size.
- Modify graphs.py by replacing plt.xlim and plt.ylim
(in the main function) with an equivalent plt.axis statement.
Active Learning
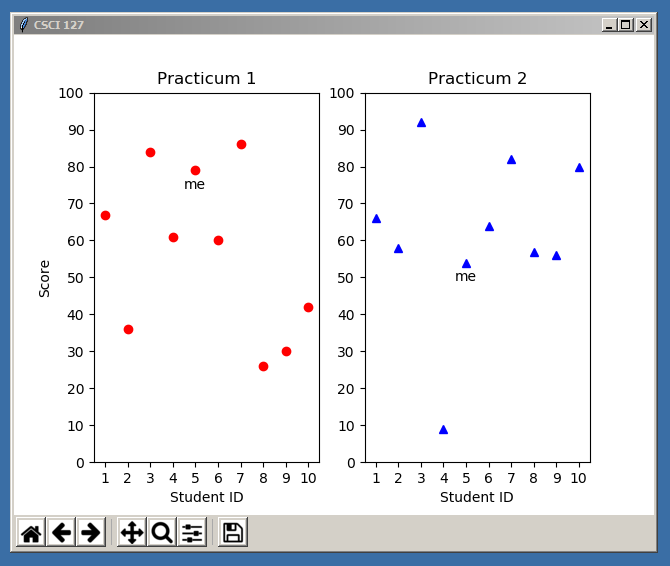
- Reproduce this graph as closely as possible.
- Assumption: There are 10 students whose student IDs are 1 through 10.
- Assumption: Practicum scores can range from 0 to 100 and
are generated randomly.
- Assumption: You are student 5. The label me appears below
each of your scores.