Weather Data Analysis Assignment
- Due Date: Wednesday, May 3rd no later than 10:00 p.m.
- Purpose: To learn to use the pandas package to
visualize data.
- You may either complete this assignment individually
or with a partner who is different from your Assignment 2
or Assignment 5 partner.
Assignment Overview
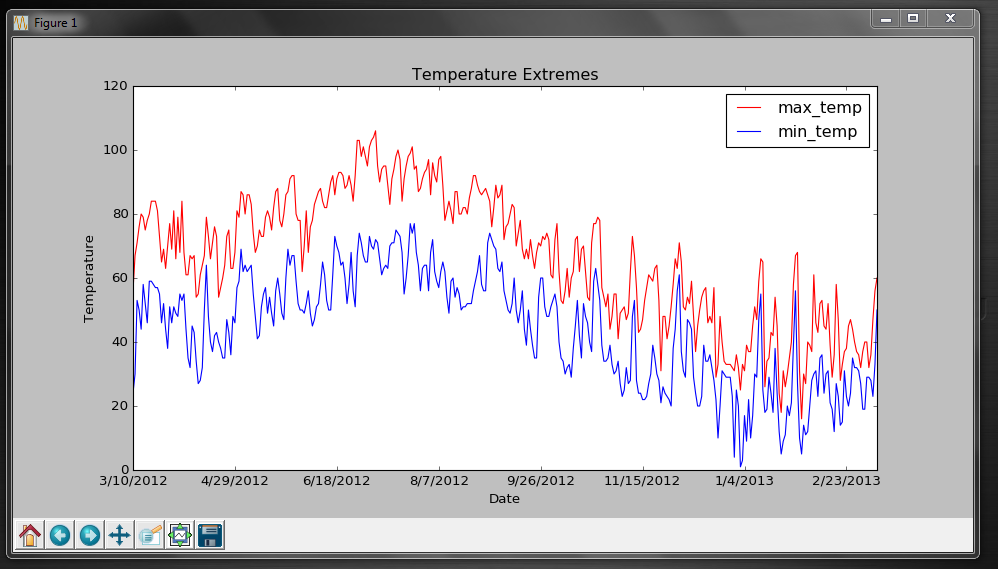
Write a Python program in a file named weather.py
that uses the pandas package
to visualize the weather data contained in the file
weather.csv. When the program is
run, it should produce this output
in the Python shell and this graph.
Known Partners
- Miles and Dyllan
- Riley and Nicholas
- Jericho and Anna
- Jessica and Amber
- Gabe and Alex
- Tanner and Cory
- Andrew and Eli
Grading
- 10 points. The output in the Python shell related to the hottest
mean temperature is correct and matches the sample output.
- 10 points. The output in the Python shell related to the coldest
mean temperature is correct and matches the sample output.
- 10 points. The output in the Python shell related to the number
of days with rain is correct and matches the sample output.
- 10 points. The following characteristics of the graph match
the sample graph: the title, the label on the x axis, the label
on the y axis, and the box that shows that the max_temp
is red and the min_temp is blue.
- 10 points. Dates such as 3/10/2012 appear on the x axis.
- 10 points. The maximum temperatures are graphed correctly.
- 10 points. The minimum temperatures are graphed correctly.
- 10 points. All information appears on a single graph.
- 10 points. The graph is 6 inches tall and 12 inches wide.
- 10 points. The Python code is of high quality, properly commented,
easy to understand and doesn't contain significant redundancies.
Helpful Hints
Assume weather is a pandas dataframe. Assume "name-1", "name-2"
and "name-3" are column names.
- Select information from the dataframe can be printed as follows:
print(weather[["name-3", "name-1"]])
- To plot "name-1" on the x-axis and "name-2" on the y-axis:
weather.plot(x="name-1", y="name-2")
- To add more information to the same graph with data from
"name-3" on the y-axis:
weather.name-3.plot()
Submission
E-mail the file named weather.py
to Ryan at ryanbockmon@gmail.com by the deadline.
The title of the e-mail should be JBD, Weather Assignment, Your Name
(, Your Partner's Name if you worked with a partner).
Late submissions will receive no credit, but partial credit
can be earned by making an ontime submission.