Python Reading
- Read this MatPlotLib
tutorial
through the section called Working with text.
Lecture Activity
Active Learning Warm-Up Problem
- Modify graphs.py to label the x-axis as x and
the y-axis as y.
- Modify graphs.py to plot the straight line as a series of yellow dashes.
Hint.
- Modify graphs.py to draw the straight line with 5 point size.
- Modify graphs.py by replacing plt.xlim and plt.ylim
(in the main function) with an equivalent plt.axis statement.
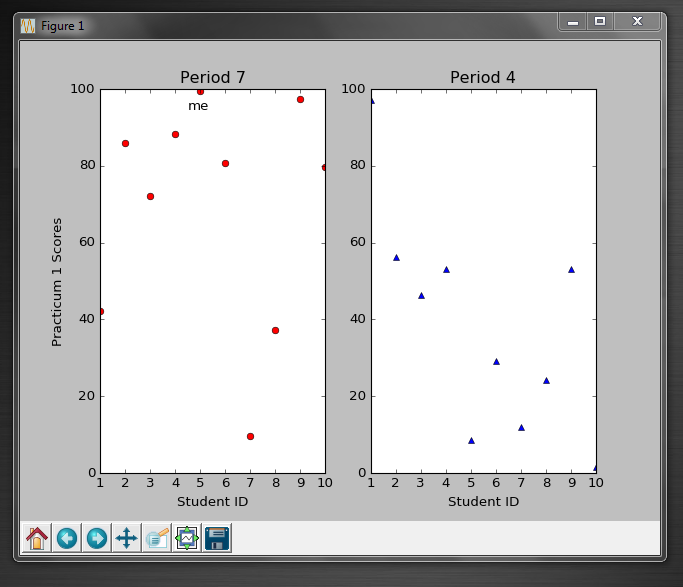
Active Learning Challenge
- Reproduce this graph as closely as possible.
- Assumption: There are 10 students in each period.
- Assumption: Practicum scores can range from 0 to 100 and
are generated randomly.
- Assumption: You are student 5 in period 7. The label
me appears below your score.