Why are biofilm chemistry and biology so spatially heterogeneous?
Gradients have been measured in biofilms
Concentration gradients of metabolic substrates, products, and microbial species constitute one of the hallmarks of the biofilm mode of growth. Some of the metabolites for which concentration profiles have been experimentally measured in biofilms include oxygen, nitrite, nitrate, ammonium, pH, sulfide, and methane. The slow and spatially heterogeneous growth of microorganisms within biofilms (31, 38, 42) surely results from such nutrient gradients.
Reaction-diffusion phenomena create environmental microniches that allow for the coexistence of diverse species (3). Some examples of the rich ecology that is possible in biofilms are expounded on below.
There are now a few elegant studies in which chemical gradients measured by using microelectrodes have been related to the distribution of specific bacterial species by in situ hybridization to fluorescently labeled oligonucleotide probes (19, 20, 24, 27, 29). These studies confirm that distinct chemical niches exist at different depths in biofilms. They also make it possible to understand how metabolically diverse microorganisms coexist in the biofilm. In nitrifying biofilms, for example, ammonia-oxidizing and nitrite-oxidizing bacteria coexist in close association (Figure 4-7, below) .
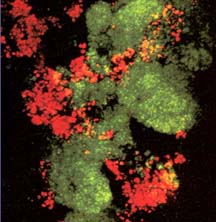
Clusters of nitrite oxidizers crowd around distinct clusters of ammonia oxidizers (20, 29). Thus, is the metabolic waste product of the ammonia oxidizers, nitrite, made available to the bacteria that can use it as a substrate for oxidation. The activities of these commingled species lead to the consumption of ammonia and oxygen near the biofilm surface and the simultaneous production and consumption of nitrite slightly below the biofilm surface.
Other phenomena in biofilms that can be understood, at least in part, by analyzing diffusive transport include different patterns of gene expression in comparison to suspended-cell cultures, microbially influenced corrosion, tolerance of antimicrobial agents, and changes in the apparent kinetics of microorganisms growing in biofilms.
It is increasingly clear that bacteria in biofilms display special phenotypes that are reflected at the gene and protein level. Among the genes and proteins that appear to be differentially regulated in biofilms are those involved in metabolism or starvation responses (14, 21, 28, 39, 41). This regulation could easily be the result of incomplete penetration of nutrients or electron acceptors into the biofilm. One mechanism by which patches of bacteria can induce corrosion of ferrous metals is by creating local anaerobic zones on a metal surface that is elsewhere exposed to oxygen. This gives rise to so-called "differential aeration cells" and sets in motion a self-propagating electrochemical cycle that causes dissolution of metal in the anaerobic zones.
Two of the leading explanations for the reduced susceptibility of microorganisms in biofilms also depend on reaction-diffusion interactions. Retarded or incomplete penetration of an antimicrobial agent arises when the agent reacts with or sorbs to biomass in the surface layers of the biofilm faster than it diffuses into the biofilm interior. A second mechanism of reduced biofilm susceptibility hinges on gradients in growth rate inside biofilms. Microorganisms in some strata of the biofilm, where nutrients have been locally depleted, may enter a non-growing state in which they are less susceptible. Changes in the apparent value of a half-saturation coefficient (Km) or in the apparent reaction order of substrate utilization are common in biofilms and are easily explained by incorporating the process of diffusion.
Two example calculations
We will now turn to some simple calculations that can describe reaction-diffusion phenomena in a biofilm. The following equations derive from the same assumptions outlined in the previous section, except that the constraint on the solute reaction has been relaxed and the system is assumed to be at steady state. It is also necessary to assume a form for the intrinsic kinetics of the reaction. In the interest of simplicity, all of the following formulae derive from zero-order kinetics. This means that the reaction rate of the solute does not depend on its concentration. If one thinks in terms of Monod or Michaelis-Menten kinetics, this is the case for substrate concentrations much greater than the half-saturation coefficient (Km).
When zero-order kinetics prevail, the reacting solute will be depleted at some point in the biofilm, provided the biofilm is thick enough. The penetration depth, a, of a reacting solute in a flat slab is given by:
 (3)
(3)
where So is the solute concentration at the biofilm-bulk fluid interface and ko is the volumetric reaction rate of the solute inside the biofilm. When the solute is a substrate for microbial growth the volumetric reaction rate is given by Ko = µ X/Yxs, where µ is the specific growth rate of the microorganism, Yxs is the yield coefficient of biomass on substrate, and X is the cell density in the biofilm.
Solute penetration in a spherical cluster, subject to simultaneous diffusion and zero-order reaction can also be calculated. A special case is when the cluster is just large enough to cause the solute concentration to go to zero at the center of the cluster. In this case, the cluster radius, which can be termed the minimum cluster size necessary to deplete the solute in the biofilm, Rmin, is
 (4)
(4)
The insight offered by these equations is illustrated with a few example calculations.
Example calculation
Here we will calculate how far oxygen penetrates into a Pseudomonas aeruginosa biofilm. The biofilm is treated as a flat slab with a cell density of 12 mg cm-3. The reaction rate of oxygen in this case is given by ko = µ X/Yxs, where µ is taken as 0.80 h-1 (37) and YxO2 is 0.85 mg of biomass per mg oxygen (1). The volumetric reaction rate of oxygen inside the biofilm (k) is thus 3.1 mg liter-1 s-1. Take the oxygen concentration in the water at the biofilm surface to be close to saturation at 6 mg liter-1. This concentration of oxygen is much larger than the Monod half-saturation coefficient for oxygen uptake, and so the zero-order kinetic model is a valid approximation. The diffusion coefficient of oxygen in water is 2.68 x 10⁻⁵ cm2 s-1 at 37°C (10), and the ratio De/Daq for oxygen in biofilms averages 0.57 (Figure 4-4). This yields a value of the diffusion coefficient in the biofilm of 1.53 x 10⁻⁵ cm2 s-1. From Equation 4-3, the penetration depth is 77 µm. This back-of-the-envelope calculation is in reasonable agreement with experimental measurements of dissolved oxygen profiles in such biofilms (8, 37).
Example calculation
How far will hydrogen peroxide penetrate into a biofilm formed by a catalase-positive organism? Suppose that the hydrogen peroxide is delivered at a bulk fluid concentration of 50 mM. As determined by Brown et al. (2), the specific peroxidase activity of uninduced P. aeruginosa is ca. 1 mmol per mg of total cell protein per min. The protein density in a P. aeruginosa biofilm is ca. 5 mg cm-3. Taking the diffusion coefficient of hydrogen peroxide in the biofilm as one-half its value in water at 25°C (34), we have De = 7 x 10⁻⁶ cm2 s-1. The calculated penetration depth in a flat slab is only 30 µm. This calculation reinforces the possibility that reactive antimicrobials may fail to penetrate biofilms.
Interactive model for reaction-diffusion
You can explore the issue of solute penetration into a biofilm using the link to an interactive model below. This model solves the reaction-diffusion problem of a solute subject to a zero-order reaction in a flat slab. This is the same problem to which Equation 4-3 applies, except that the interactive model will show you the entire concentration profile inside the biofilm. This model also allows the user to adjust the bulk fluid solute concentration, biofilm thickness, diffusion coefficient, and ratio De/Daq and receive instant feedback on how solute penetration changes.
The interactive model is based on the premise that the reacting solute is actually a biocide that kills microbial cells. Thus, the model also calculates the extent of killing in the biofilm. Simulations with this type of model show that incomplete penetration of reacting biocide into a biofilm can confer excellent protection on the cells in the biofilm.
