Equilibrium Partitioning Model Tutorial
The Equilibrium Partitioning Model used in this course is a Java translation of the "Fugacity" spreadsheet model originally developed by Brett Towler of the Montana State University Civil Engineering Department. The model is used to solve equilibrium partitioning problems in a control volume of arbitrary fractions of soil, water, air, and NAPL phases.
This version of the model is an web-based model and runs as a Java applet within the Equilibrium Partitioning Model web page. Because the model was developed using the Java 2 Platform, there are several issues that must be addressed before the model can be used.
See the Getting Started page to verify that you have the Java plug-in installed.
This tutorial consists of three main sections:
Using the Equilibrium Partitioning Model
After verifying that the appropriate Java plug-in is installed and enabled, the model can be loaded and manipulated. The purpose of this tutorial is to acquaint the user with the model and the use of its features. At this point, it is not necessary to understand the underlying meaning of any of the data values or their corresponding calculations.
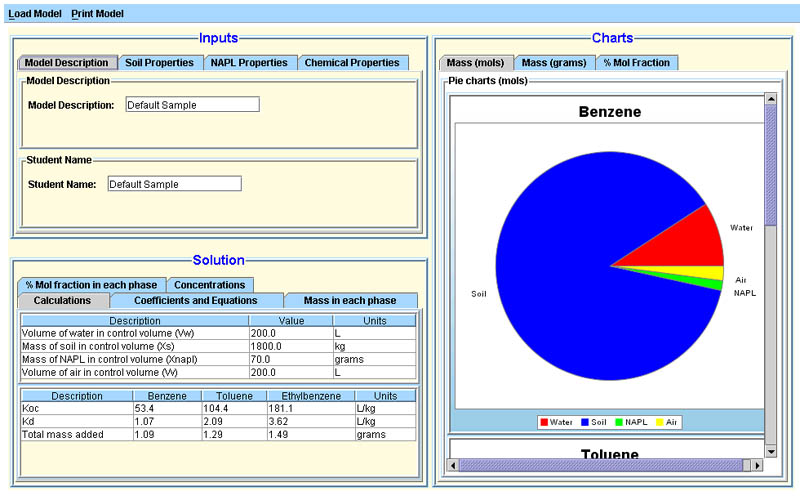
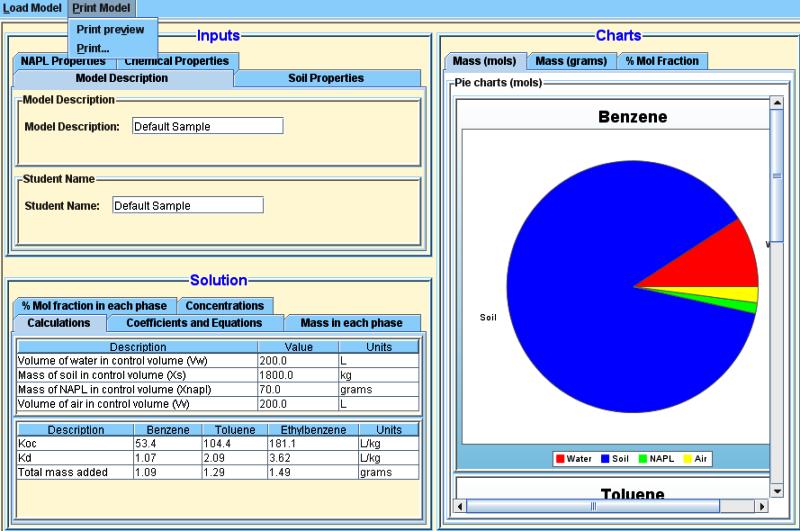
The figure below shows the Equilibrium Partitioning Model as it appears when it is first loaded. The model is initially populated with values from a default data sample and consists of the following components:
A menu bar located across the top of the model (discussed later in the tutorial)
The Inputs section located in the upper left
The Solution section located in the lower left
The Charts section located in the right
|
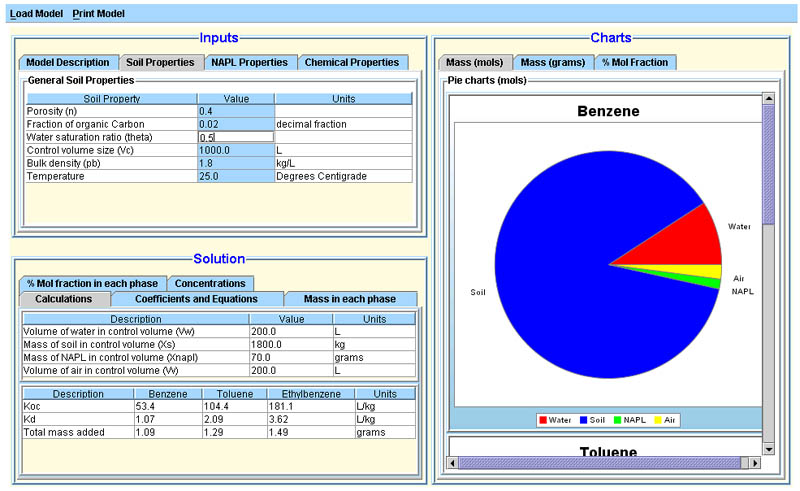
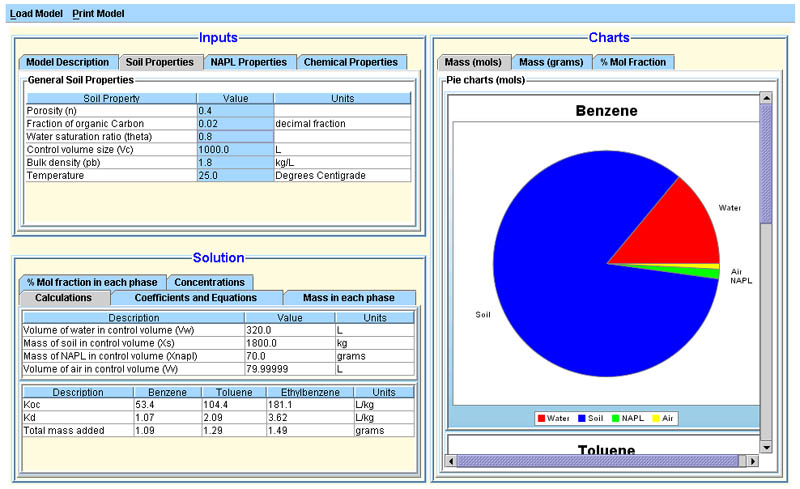
Each of the three sections consists of tabbed areas allowing the user to view various types of information by clicking the appropriate tab. Input values may be modified via the tables in the Inputs section. The tables in this section work much like a spreadsheet in that the value cells shaded in blue may be modified by first clicking in the desired value cell, then typing in a new value, and finally pressing the "enter" key. For example, to change the water saturation ratio (theta) value associated with the Soil Properties, follow the these steps:
-
First, click the Soil Properties tab.
-
Then, click in the Water Saturation Ratio value cell. This cell will now have a white background and a blinking cursor will appear at the "click point".
-
This cell can now be modified by typing in the desired value. Use the "backspace" and/or "delete" keys to erase the former value, or simply "select" the former value and overtype it with the new value.
-
Press the "enter" key to complete the modification. The solution and charts will then be automatically updated and shown in the model to reflect the changed input value .
|
|
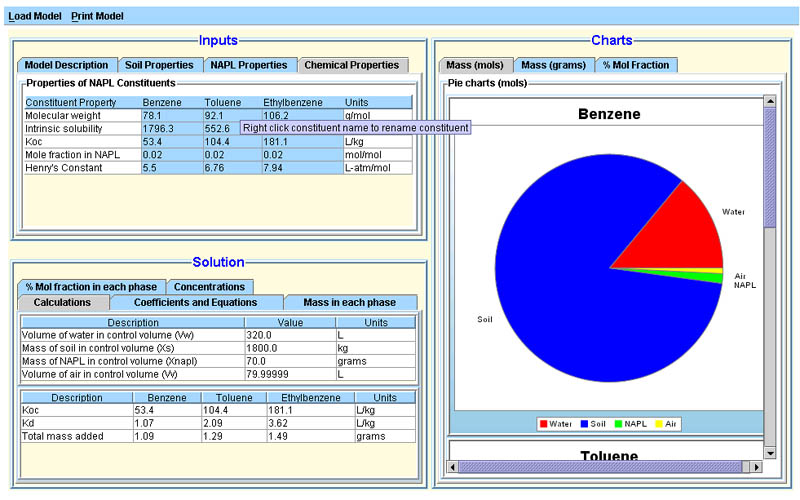
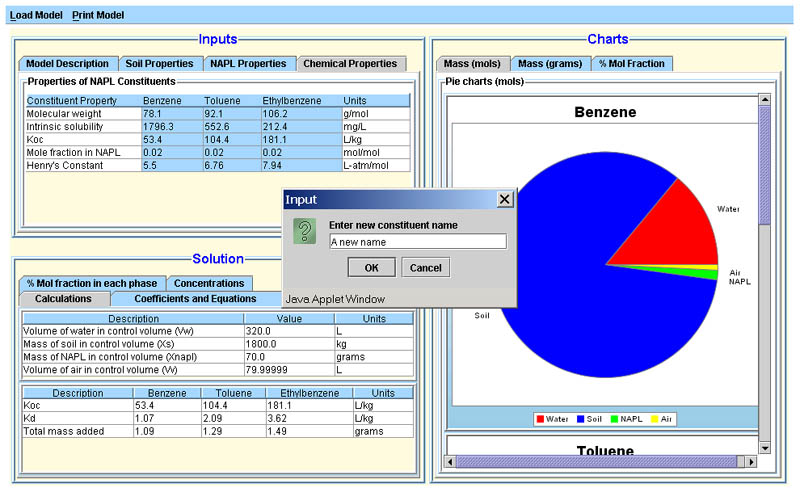
The Chemical Properties tab in the Inputs Section is used to define the various properties associated with the constituents in the model. These values may be adjusted in the same way as shown in the Water Saturation Ratio value example shown above. It is also possible to rename a constituent ... this will effectively replace a currently defined constituent with a different constituent to be considered. For example, to eliminate Toluene in the default sample and replace it with a new constituent named "A new name", follow these steps:
-
First, click the Chemical Properties tab (if it is not already the active tab).
-
Then, right click in the header cell holding the name Toluene. A dialog box requesting the entry of the new name will then appear. Type in the new name and then click the OK button. Clicking the Cancel button will cancel the operation and no change will occur.
-
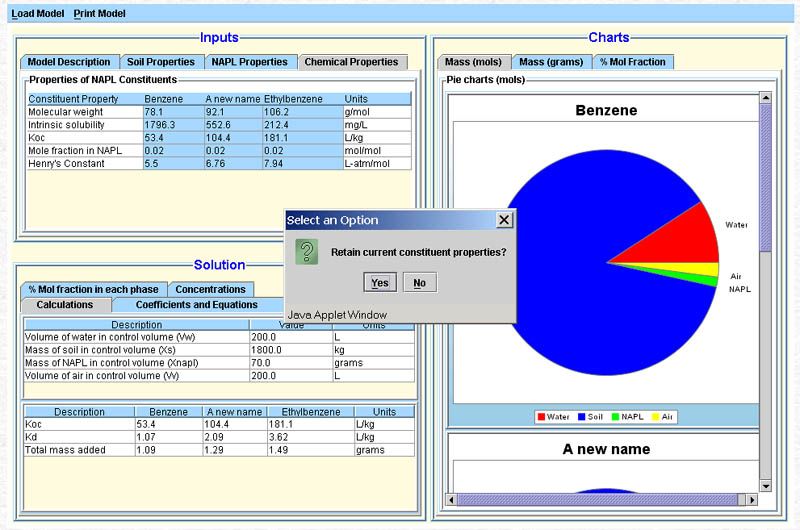
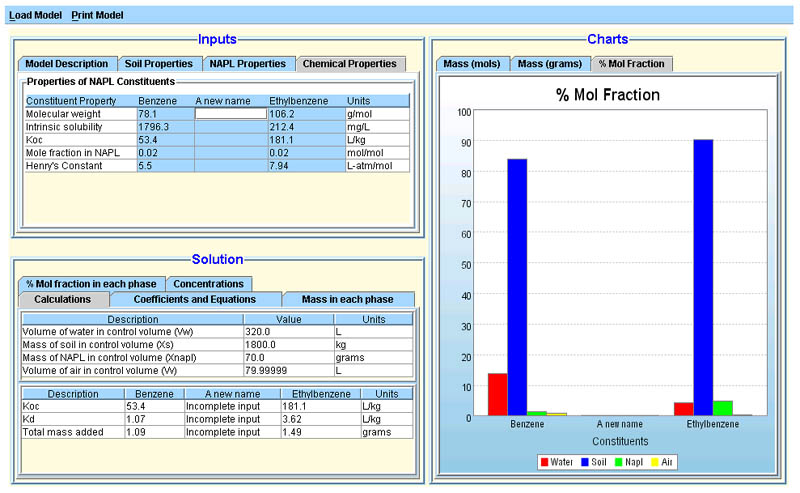
If the OK button was clicked, a second dialog box will appear asking whether or not to retain the current property values. It may be desirable to click the YES button to retain the current properties (e.g., if a spelling correction is needed for a previously defined constituent). If the NO button is clicked, the values in the column associated with the "new" constituent will become blank. The new values can then be entered. Until all the new values are entered (i.e., the input data is complete), neither the Solution Section nor the Charts Section will reflect the new constituent.
|
|
|
|

|
The model's menu bar consists of two menus:
- The Load Model menu
- The Print Model menu
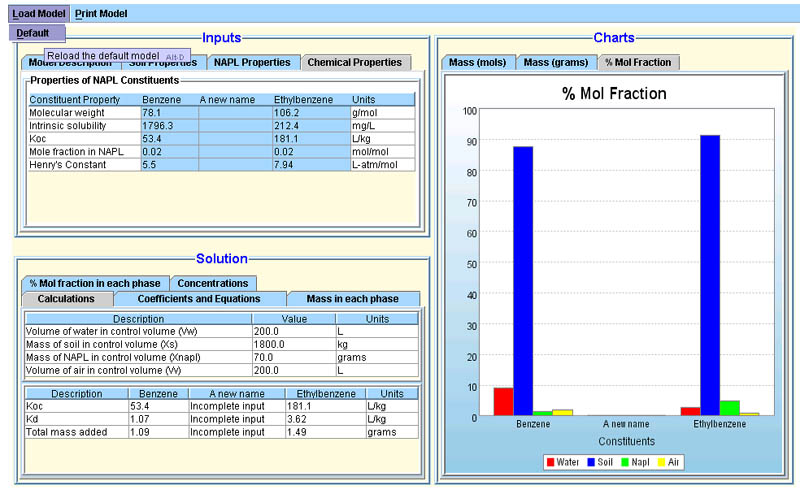
The Load Model menu allows the user to reload the default data model sample. Use the following steps to reload the default model:
- Click the Load Model menu. The corresponding menu item is now visible.
- Click Default in the menu item list.
- The Default sample model is then loaded into the Equilibrium Partitioning Model and is ready for viewing and manipulation.
|
|

The model cannot be printed by using your browser's print button or by using your browser's Print menu. Instead, use the Print Model menu within the model itself. The Print Model menu has two options: Print preview and Print.
|
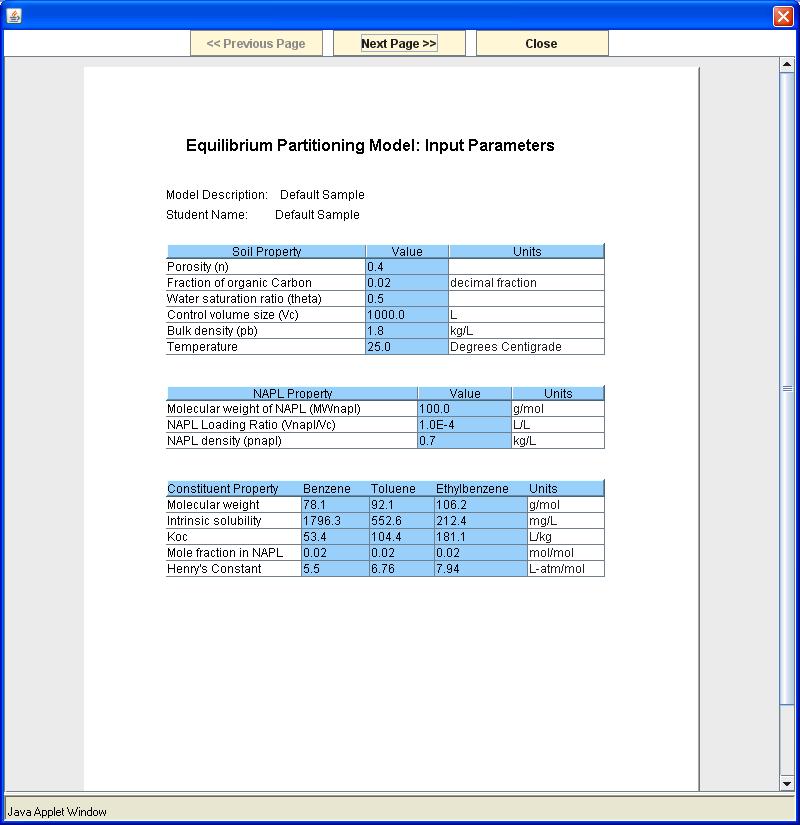
The Print preview option produces a window showing the first page of the model's data. Use the buttons at the top of this window to page through the data and to close the preview. NOTE: Currently, the only chart printed from the model is the % Mol Fraction bar chart.
|
The Print option will first produce a Java Security Warning. Click the OK buttion to allow the model (named Fugacity_Applet) to be printed on your printer.
|
